
Pricing portfolios, not just bonds: Introducing CP+ Portfolio Trading

Executive summary
Portfolio trading (PT) is an important part of credit market execution, offering buy-side firms a more efficient way to transfer risk and source liquidity. Accurately estimating the cost of a portfolio trade requires pre-trade analytics that account for the characteristics of the entire basket, rather than simply aggregating individual bond-level predictions.
CP+™ Portfolio Trade (CP+ PT) from MarketAxess is purpose-built to estimate transaction costs at the basket level, incorporating portfolio-level context such as basket size, composition, and prevailing market conditions to deliver a more precise estimate of expected execution costs. It is integrated into X-Pro PT, helping traders optimize portfolio construction and make more informed pre-trade decisions.
A reintroduction to the CP+ ecosystem: purpose-built tools for every workflow
CP+ is our suite of AI-driven pricing and analytics products, each engineered for a specific trading context. While they share a common foundation in machine learning and unparalleled transaction data from MarketAxess, they differ in scope, protocol, and calibration.
| Product | Scope and granularity | Use case | Key takeaway |
|---|---|---|---|
| CP+ Core | Bond and side | Price discovery, transaction cost analysis (TCA) | Two-sided predictive pricing calibrated to observed trades |
| CP+ Responder | Bond, side, size and target hit rate | Liquidity provision calibration | Optimized pricing for liquidity providers |
| CP+ Size | Bond, side, size, and client type | RFQ cost estimation | No-discretion price available to liquidity takers |
| CP+ PT | Bond, side, size, and client type, at basket level | PT cost estimation | Aggregate price specific to a particular order and scenario, accounting for ETF levels |
CP+ PT extends the CP+ suite to portfolio trading with transaction cost estimates for basket-level execution. It creates an unbiased, pre-trade prediction of portfolio trading costs calibrated using actual past trades from the MarketAxess platform.
CP+ PT is currently available for all USD bonds excluding exempt municipal bonds. Coverage includes all High Grade, High Yield, and Emerging Markets bonds that are covered by CP+ Core. Predictions can be viewed in price (bps or cents), spread (bps), or total proceeds terms.
The benefits of a purpose-built model for portfolio trades
A common approach to PT cost estimation has been to aggregate single-bond price predictions across a basket, which misses portfolio-level dynamics that influence how a dealer prices the list as a whole.
CP+ PT incorporates data from observed portfolio trades on the MarketAxess platform and additional market context, including ETF pricing, to capture portfolio-level factors and reduce previously observed biases. By leveraging PT-specific data in conjunction with CP+ pricing, we see predictions that outperform CP+ Core and Size in accuracy, reducing bias and deviation in both median and tail cases. In Figure 1, we can see that CP+ PT has a distribution more closely centered around 0 with a tighter dispersion of outcomes. This deviation is measured by the difference in realized trade outcomes against pre-trade predictions in price terms for actual PTs on the MarketAxess platform.
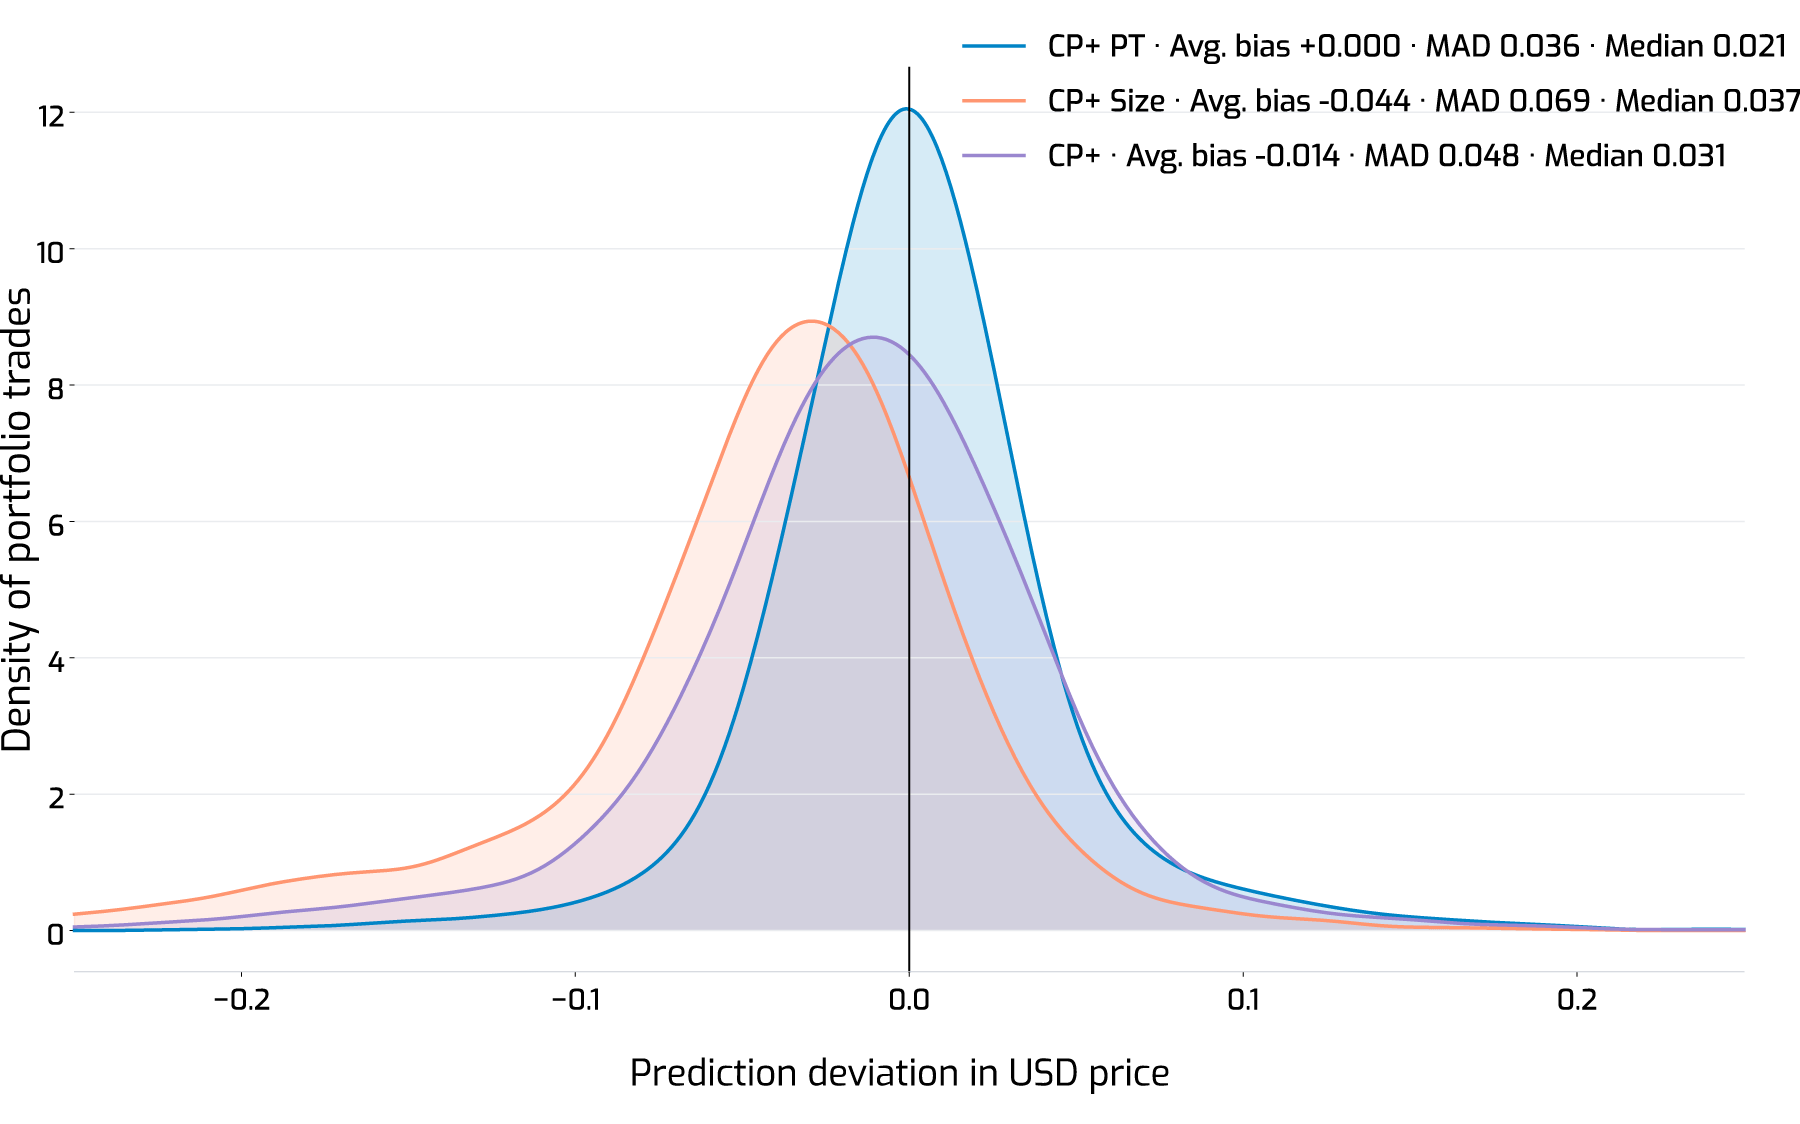
Figure 1: Distribution of pricing bias in dollar price terms for realized USD PTs on the MarketAxess platform Jan.-Sept. 2026— CP+ Core (bond-level), CP+ Size (bond-level), and CP+ PT (basket-aware).
Portfolio trading insights powered by CP+ PT
Expanding on the analysis that we discussed in the PT vs. RFQ White Paper, we are able to use predictions generated by the CP+ PT engine to observe larger trends on basket-level execution. Previously explored order features like basket size, complexion of the bonds within, and the broader market environment at the time of execution can be shown to materially impact transaction costs.
Order size
A simple factor that drives price outcomes for portfolio trades is order size, whether measured at the total basket volume or the average line-item size. As one would expect, larger baskets incur greater costs to account for market impact and balance sheet considerations.
As shown in Figure 2, expected execution costs increase by 5% of bid-ask or more for an order at several key basket sizes, including $100 million, $250 million, and $500 million of total notional. This was measured across realized lists from the MarketAxess platform for 2026 through September.
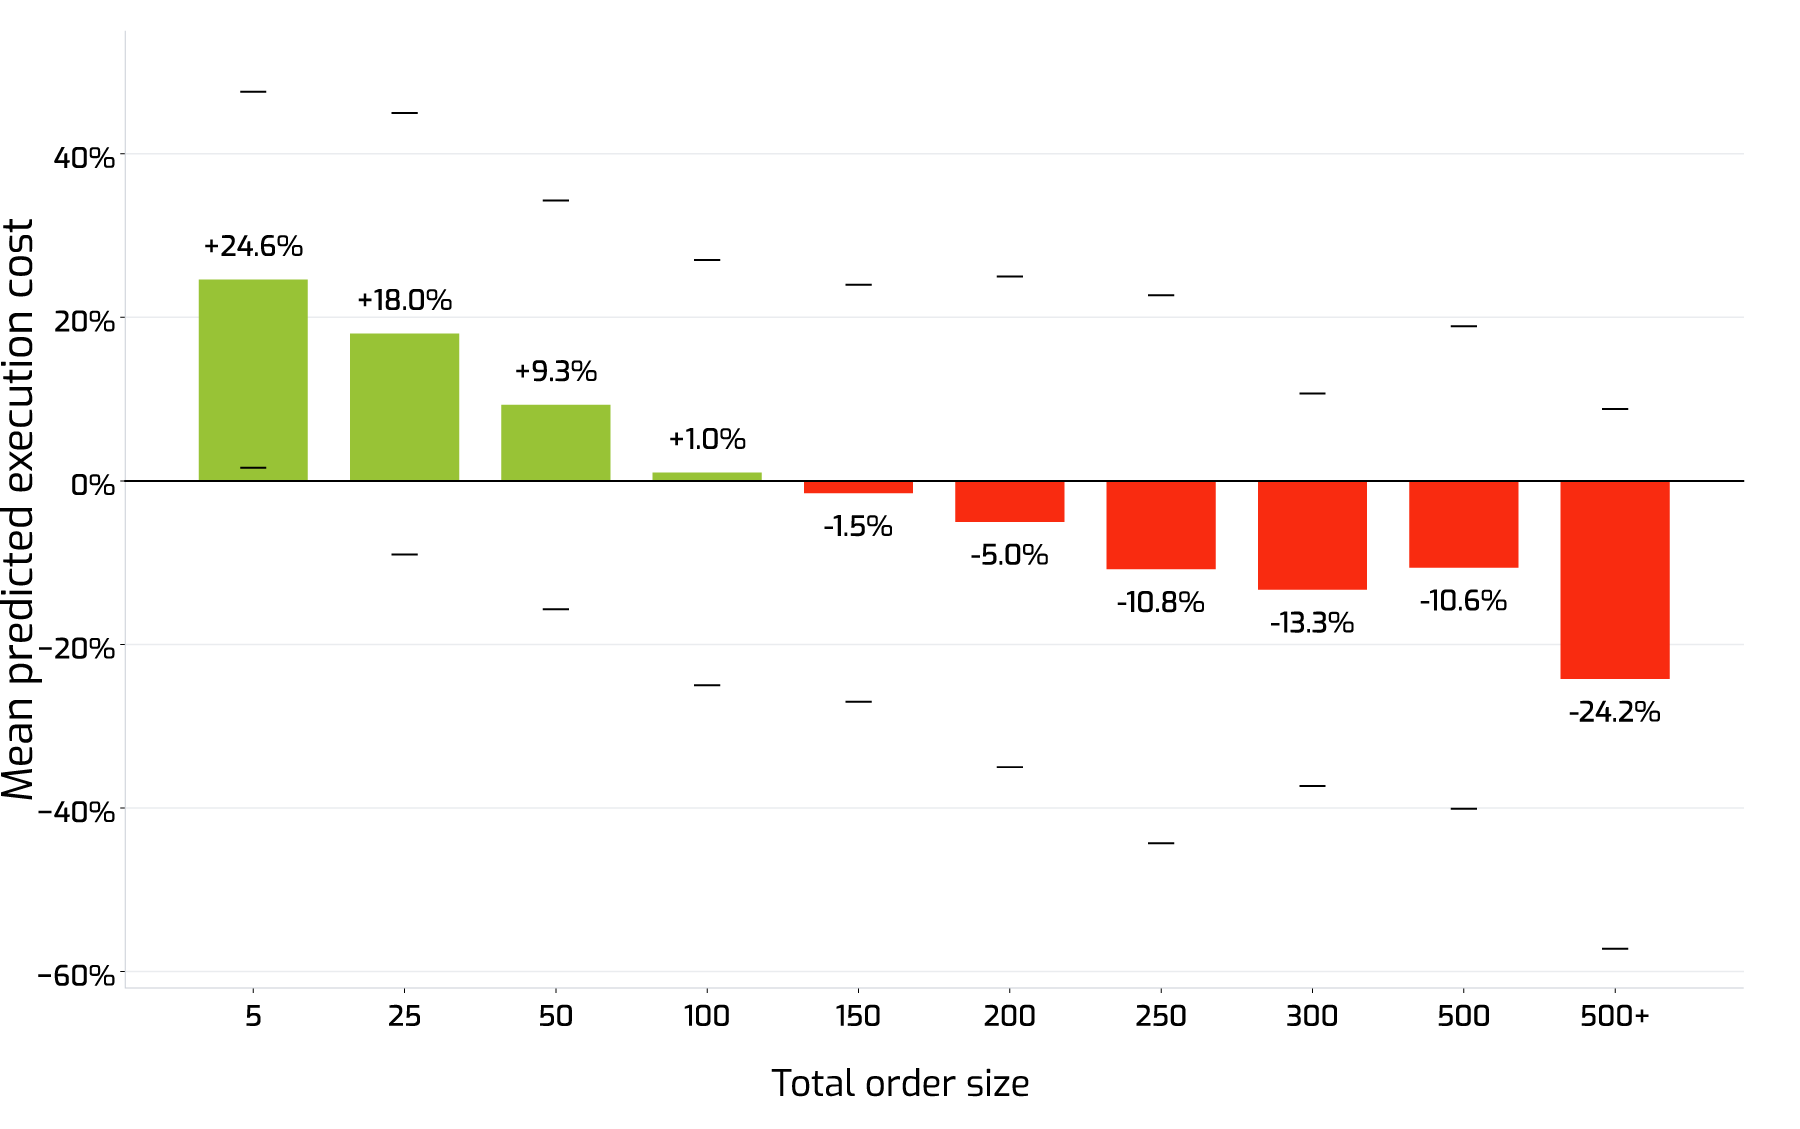
Figure 2: Mean predicted execution cost/CP+ bid-ask spread vs CP+ Side by total notional (MM). Mean across 600+ realized lists from Jan.-Sept. 2026; whiskers = ±1 standard deviation.
As noted in previous white papers about CP+, this can be useful for the planning of routing within a strategy. RFQ tends to see lower cost premiums than PT at high volumes, bringing in the possibility of splitting a PT into multiple smaller baskets or routing some portions of the order towards RFQ in situations where discretion is available and costs are a principal concern.
Average line item size
Similar to the above, the average size of the orders within a basket also have an impact on expected trading costs for a portfolio trade. Even for lists that have a smaller total footprint, baskets that are concentrated into larger trades see expected cost premiums. This is commonly due to decreased diversification and single-name risks that warrant considerations from liquidity providers.
Figure 3 below visualizes the predicted impact of average line item size on trading costs using CP+ PT. This was generated using a set of sample lists from realized trades on MarketAxess, sized up and down while keeping other order details constant. We see a notable breakpoint at 250k for smaller sized orders, where costs change by roughly 10% of bid-ask spread. Additionally, block orders above 5MM on average are expected to incur additional costs.
Average line item size
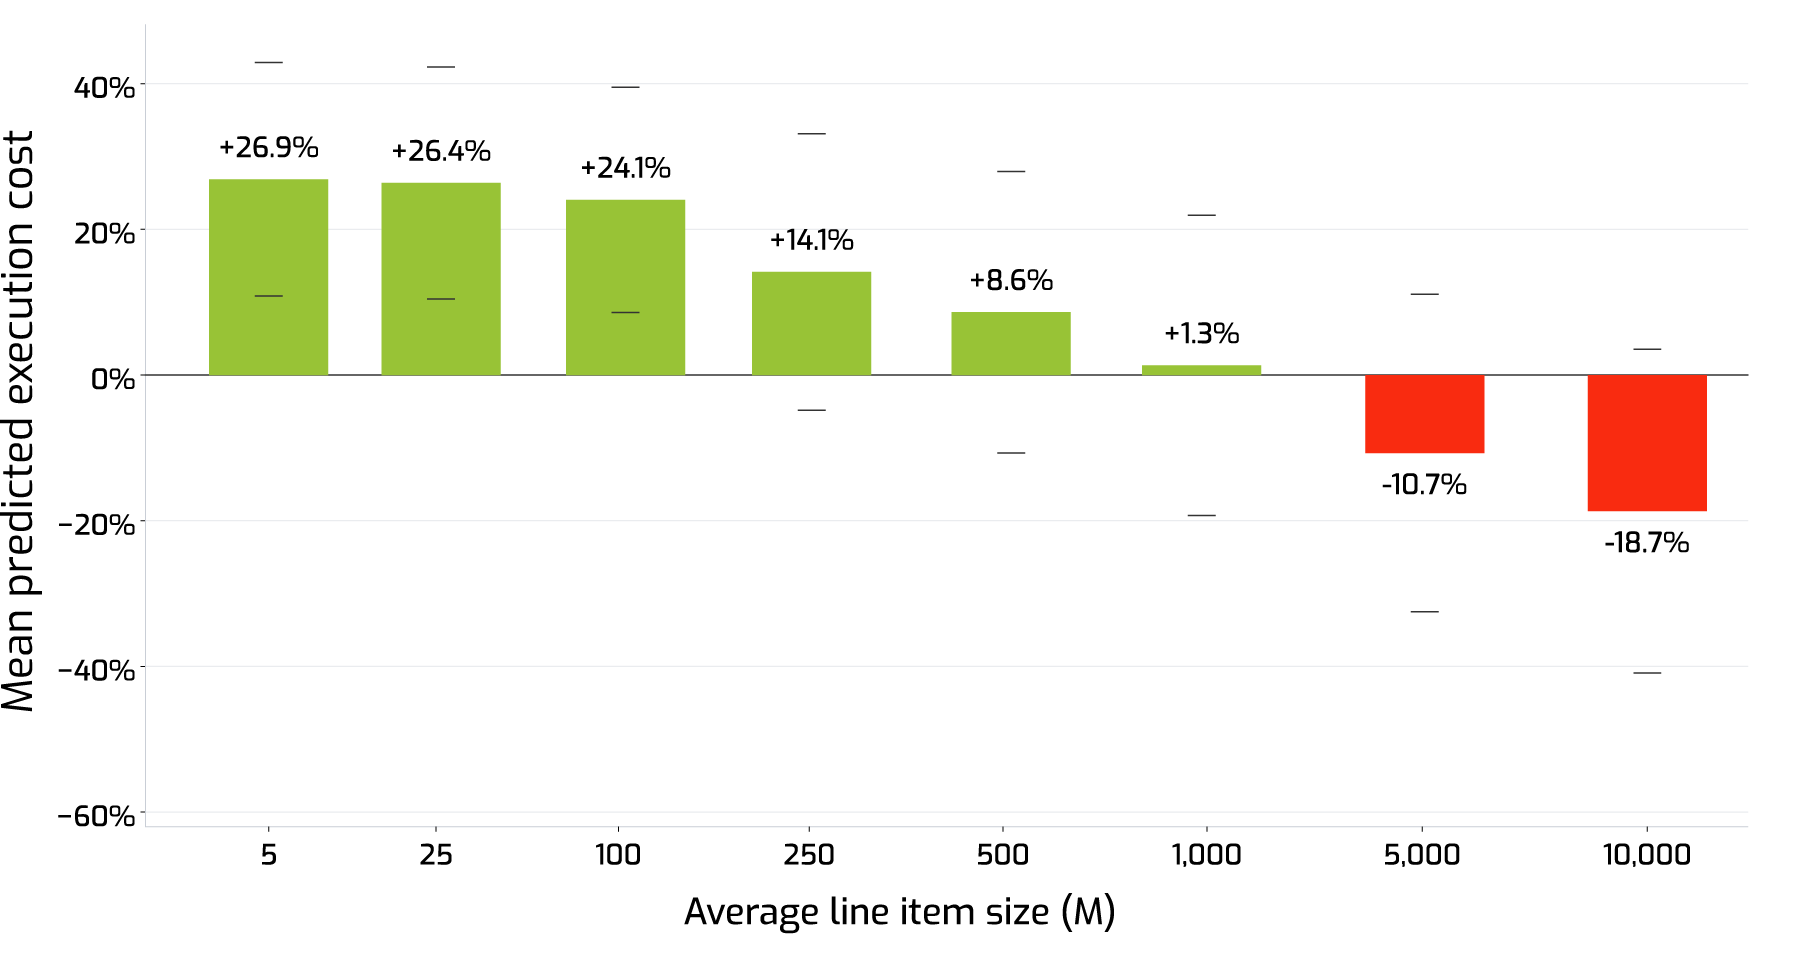
Figure 3: Mean predicted execution cost/CP+ bid-ask spread vs CP+ Side by average line item size(M). Mean across 300 sample lists from Jan.-Sept. 2026; whiskers = ±1 standard deviation.
ETF premium/discount
ETF trading has accelerated the growth and adoption of PT trading. Dealers can use ETFs to add or reduce index exposure when hedging the risk associated with a portfolio trade and the relative pricing of an ETF can influence those decisions. The premium or discount at which a reference ETF trades relative to its net asset value (NAV) is therefore a significant cost signal for PT, as cost savings are often passed at least partially back to clients.
ETF price advantage quantifies how favorable an ETF’s valuation is for a given order at time of trade, measured as a directional magnitude. A negative value indicates lower expected trading costs, generally reflecting an ETF trading at a discount for client buys and a premium for client sells.
ETF price advantage
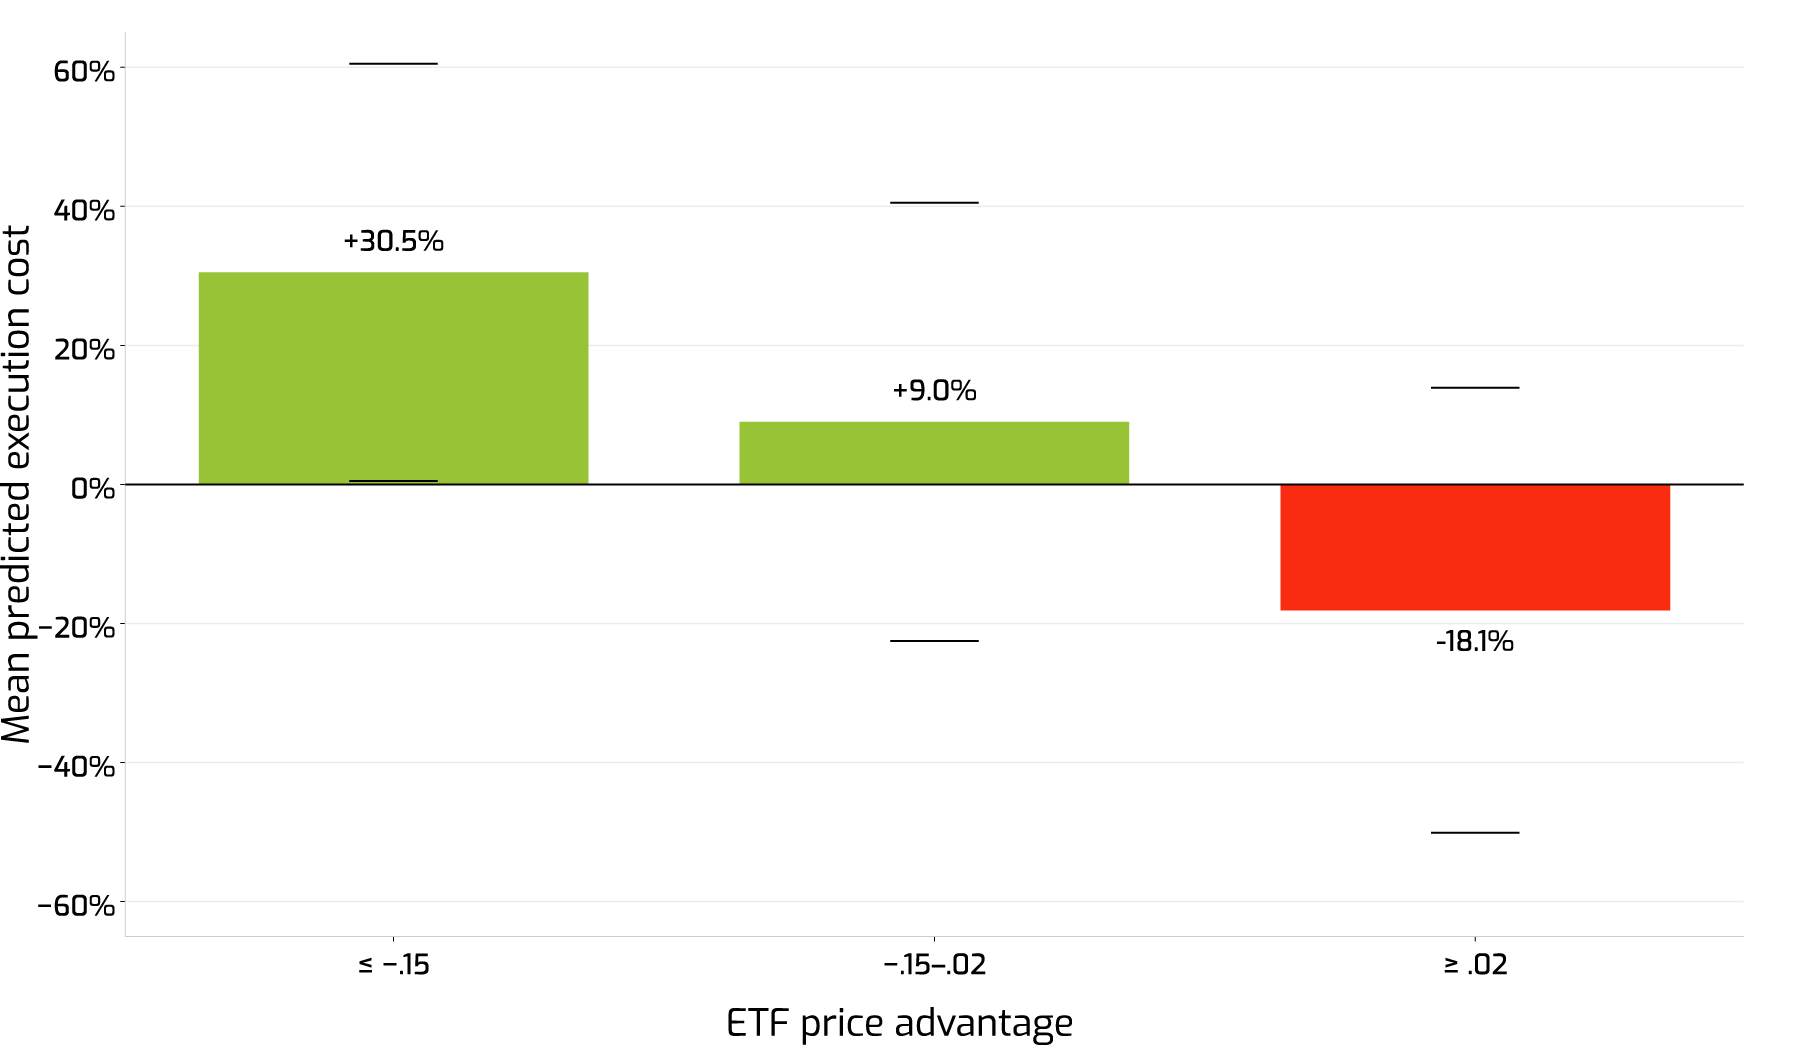
Figure 4: Mean predicted TCA/spread by ETF premium/discount at time of trade. Mean across 25 realized lists with simulated ETF conditions; whiskers = ±1 standard deviation.
Figure 4 illustrates this relationship with direct correlation. Predictions from CP+ PT across otherwise similar baskets show expected transaction costs differing by as much as half of bid-ask spread depending on ETF conditions.
Beyond the ETF's NAV, the degree to which individual bonds in a basket correlate with the underlying ETF's returns is a critical determinant of expected pricing. Past discussions have shown that this expectation of returns is a more critical feature to cost modeling than a simple share of a basket that overlaps with ETF constituents. Past analysis has shown that return correlation can have an impact on costs of up to 20% of bid-ask spread even in similar premium/discount scenarios.
How to access and utilize CP+ PT
The CP+ PT product has been implemented directly into the X-Pro PT pre-trade workflow, providing cost estimates at the point when PT lists are being constructed and order workflow is being determined.
Within the X-Pro PT pre-trade screen, users can generate list-level PT and RFQ cost estimates to support:
Choosing which bonds to include or exclude from a PT list to optimize execution.
Determining size premium attached to lists and showing which bonds are most impactful.
Observing current ETF market conditions that drive execution.
Breaking out buy and sell exposure for multi-sided lists.
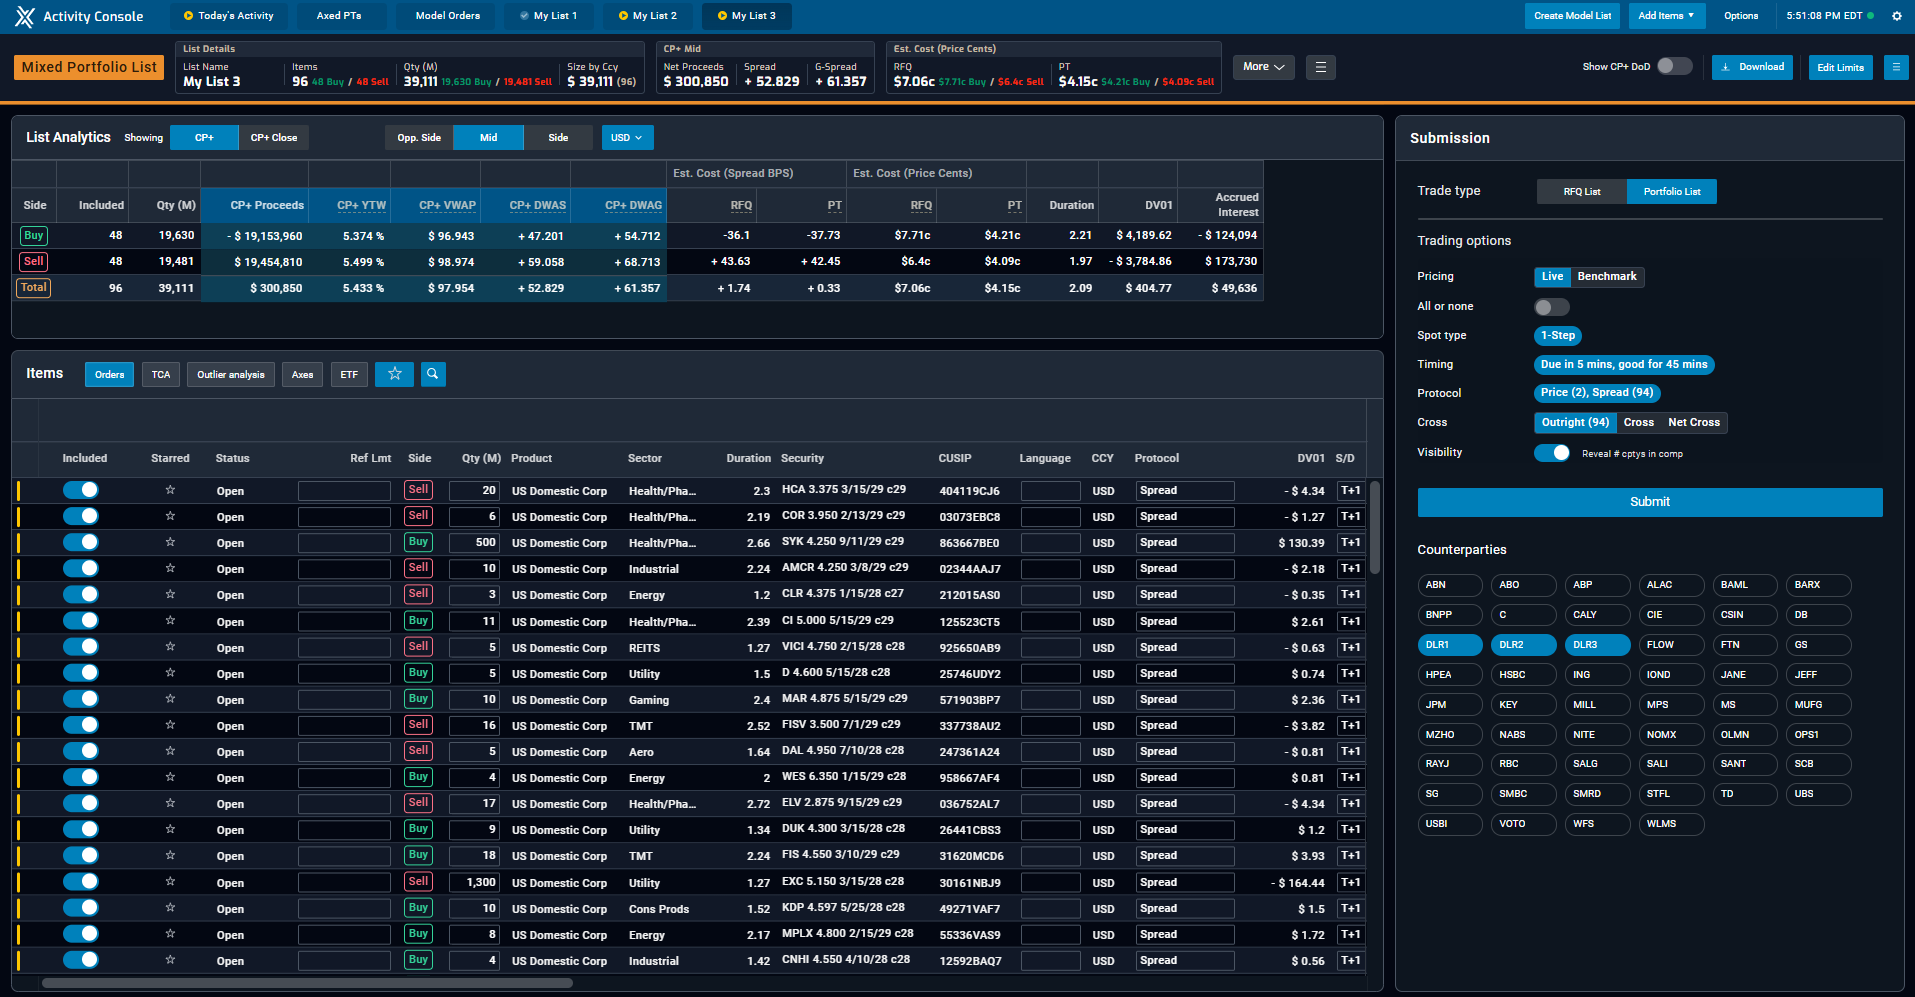
Figure 5: CP+ PT predictions will be available in the X-Pro PT screens for pre-trade assessment.
Conclusion
The growth of portfolio trading in credit markets has created a structural demand for better pre-trade analytics. CP+ PT is built specifically for the PT workflow, trained on real, basket-level outcomes and designed to give buy-side traders an unbiased cost estimate. Now integrated into the MarketAxess X-Pro PT workflow, CP+ PT provides greater transparency before execution, helping traders evaluate orders with greater clarity and confidence.